Monitor Kafka consumer lag and cluster health
Live broker and topic metrics, lag broken down by group and partition, and automated health checks that flag risk before it becomes an incident.
A stuck consumer rarely announces itself
Finding it usually means running kafka-consumer-groups.sh by hand, cross-referencing broker metrics from a separate dashboard, and guessing which partition is actually the problem.
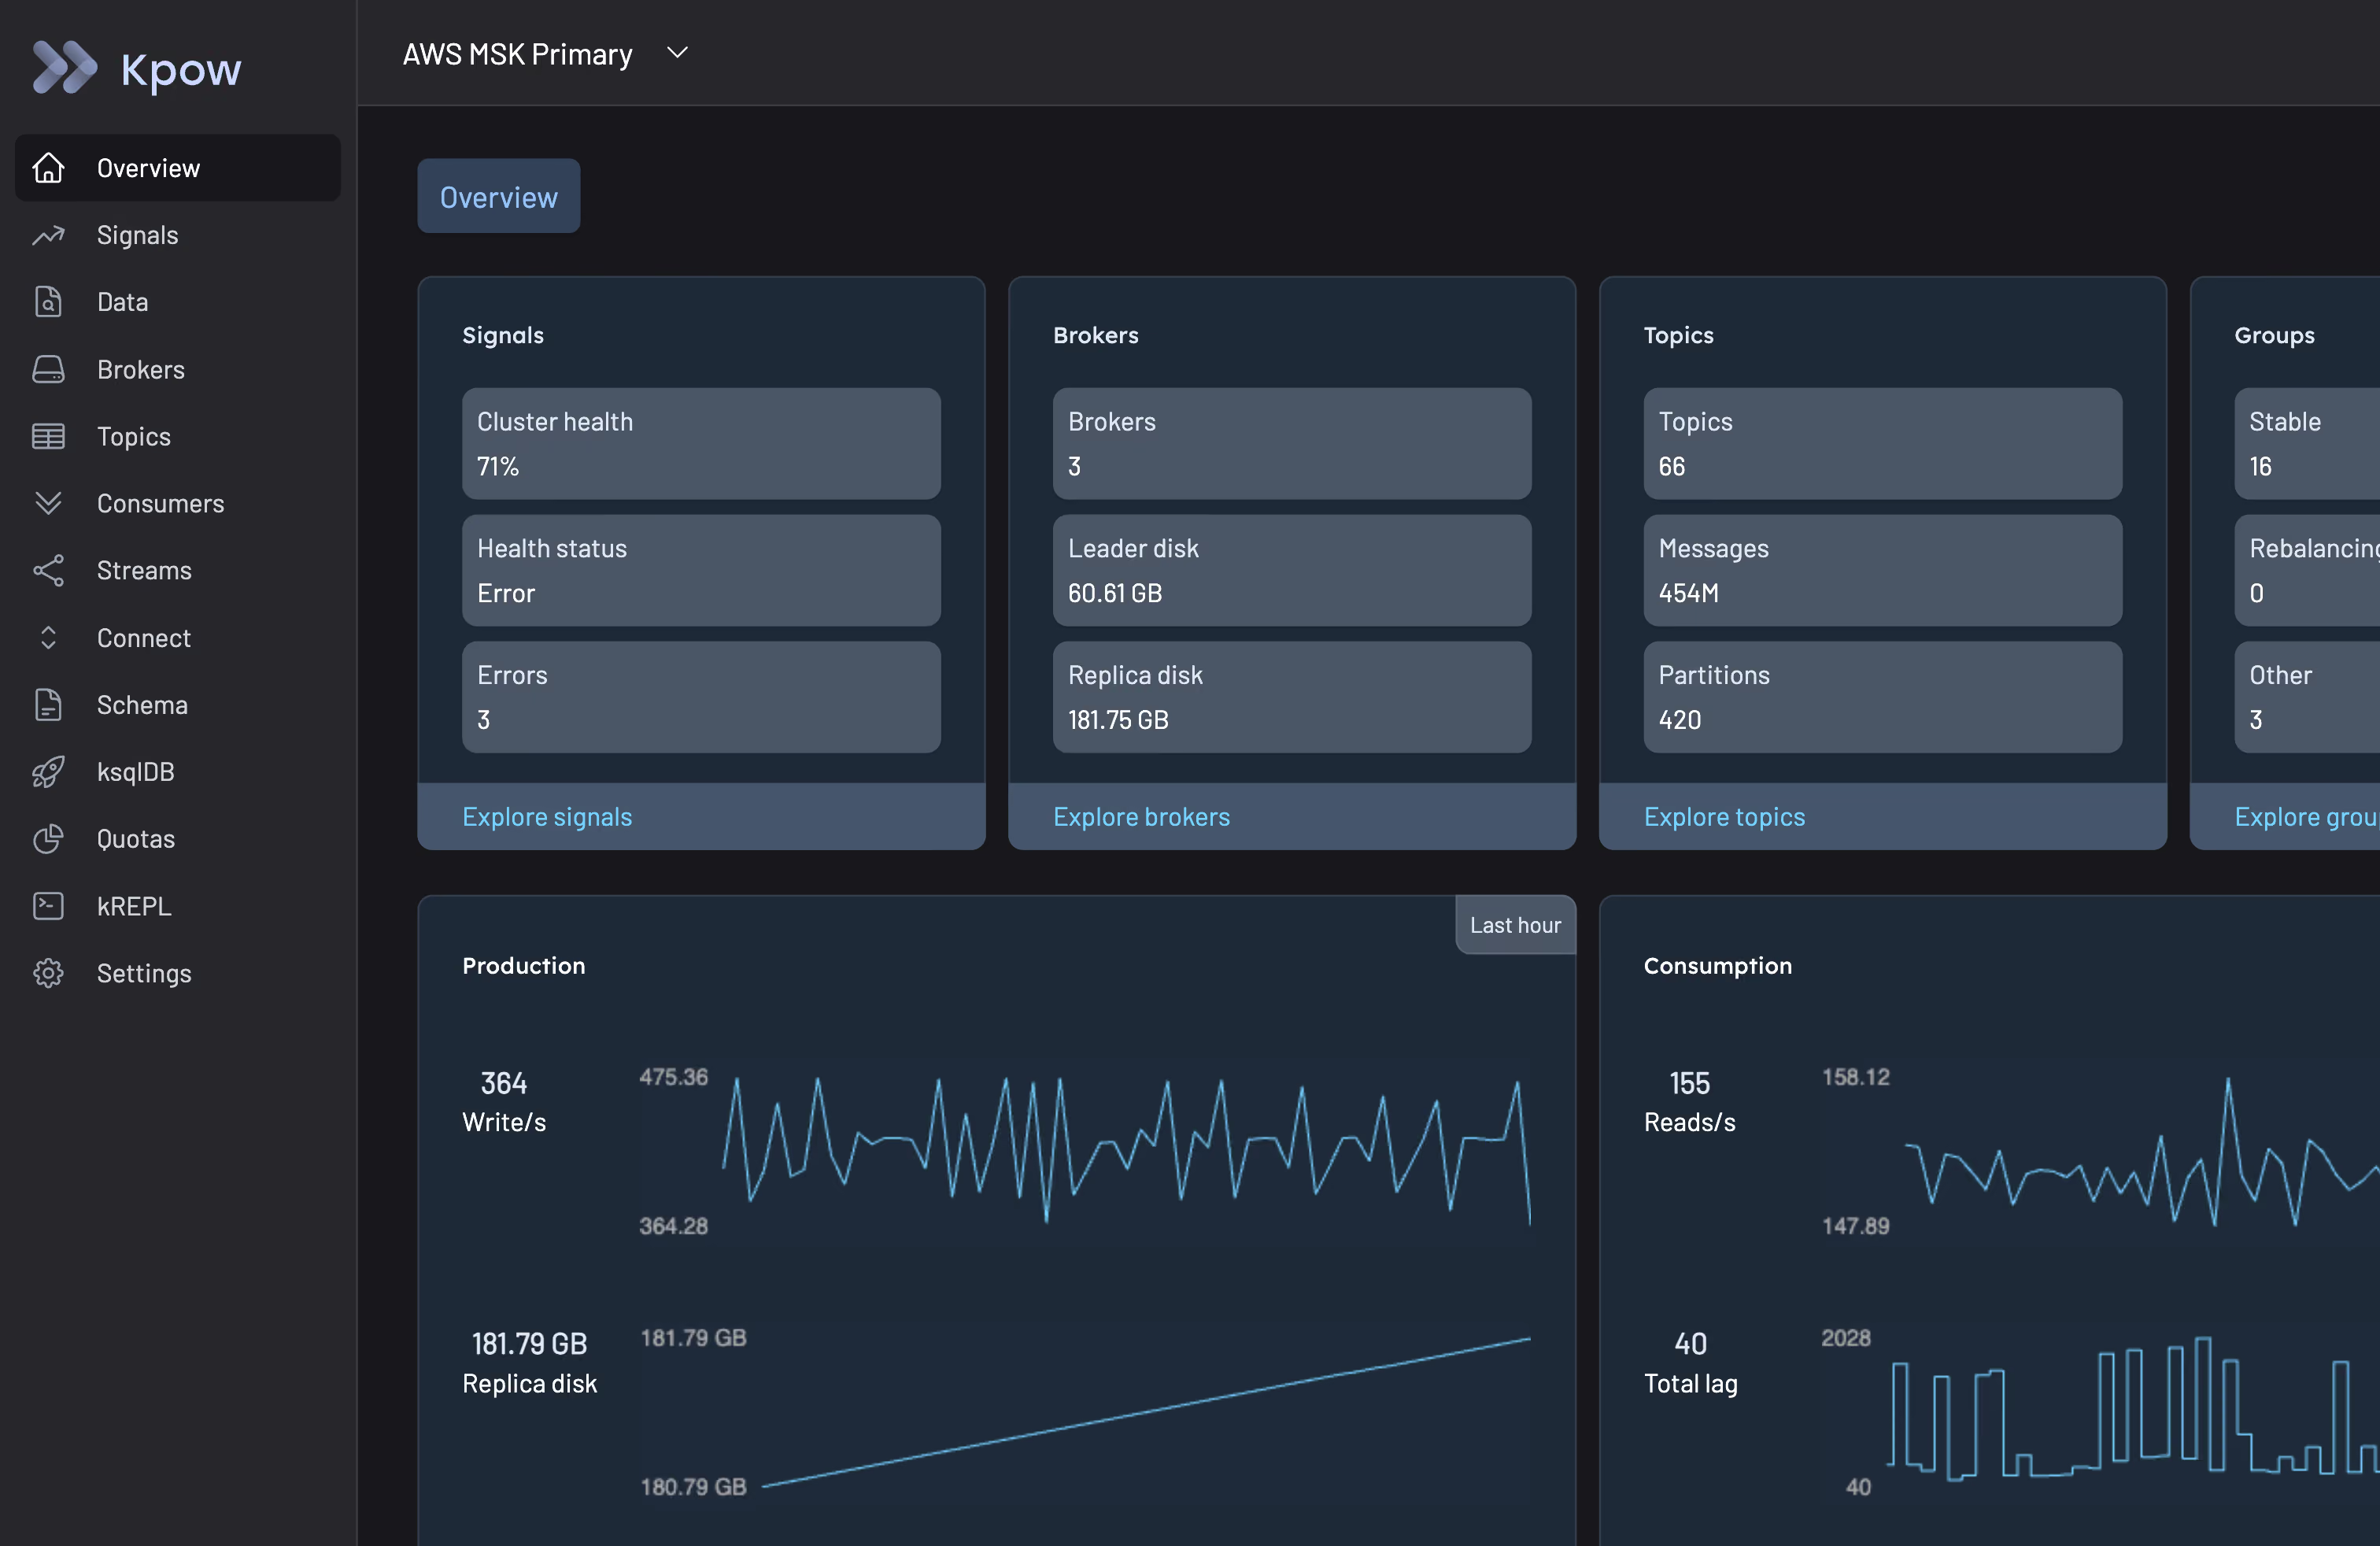
Monitor lag, metrics, and cluster health in one view
Consumer lag, broken down
See lag by group, topic, partition, host, and broker, all at once. Kpow also automatically detects every Kafka Streams application running against your cluster, so its consumer groups show up without manual setup.
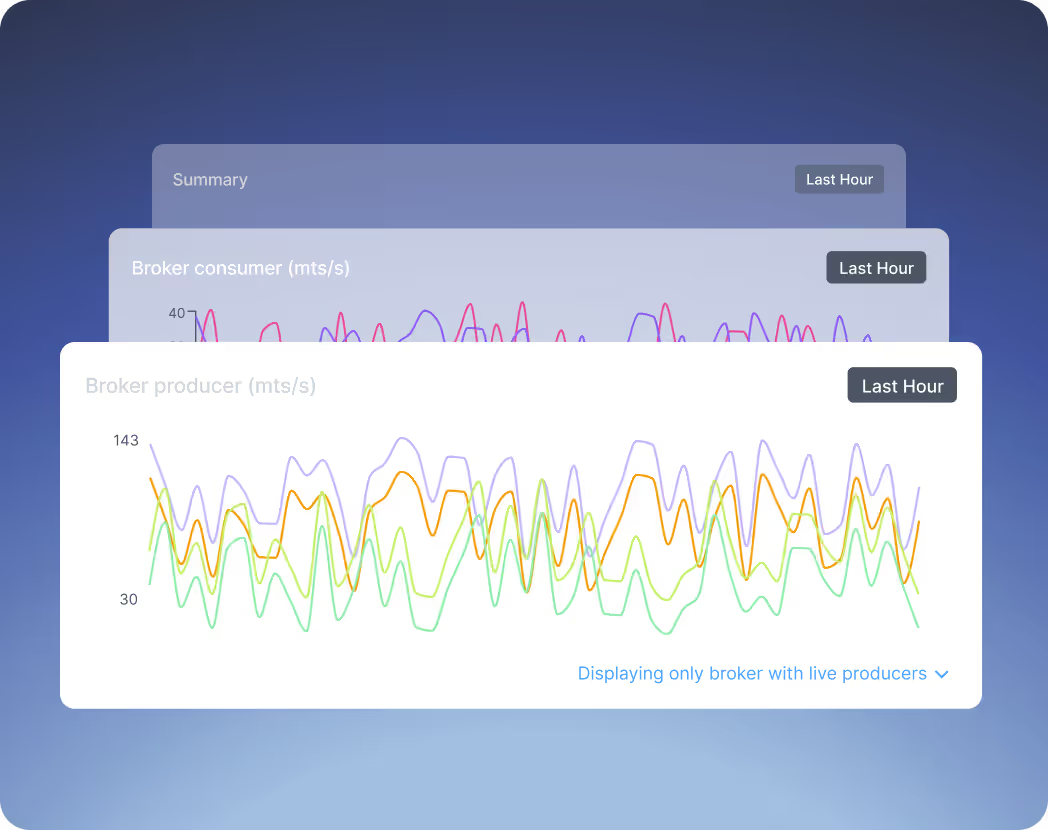
Live broker & topic metrics
Summary metrics across brokers, topics, and consumer groups the moment you connect, with a live mode for real-time updates.
- Filter and compare resources side by side
- Surfaces under-replicated partitions, inactive consumers, and stalled offsets directly in the comparison view
Cluster health score
Signals rolls every check up into a single health score and status badge (OK, Warning, or Error), so you can see cluster-wide risk at a glance instead of reading metrics one at a time.
- Health score and issue counts are recorded as metrics, so you can track trends over time, not just current state
- Checks are grouped by resource (broker, topic, consumer group), each rolling up to its own status
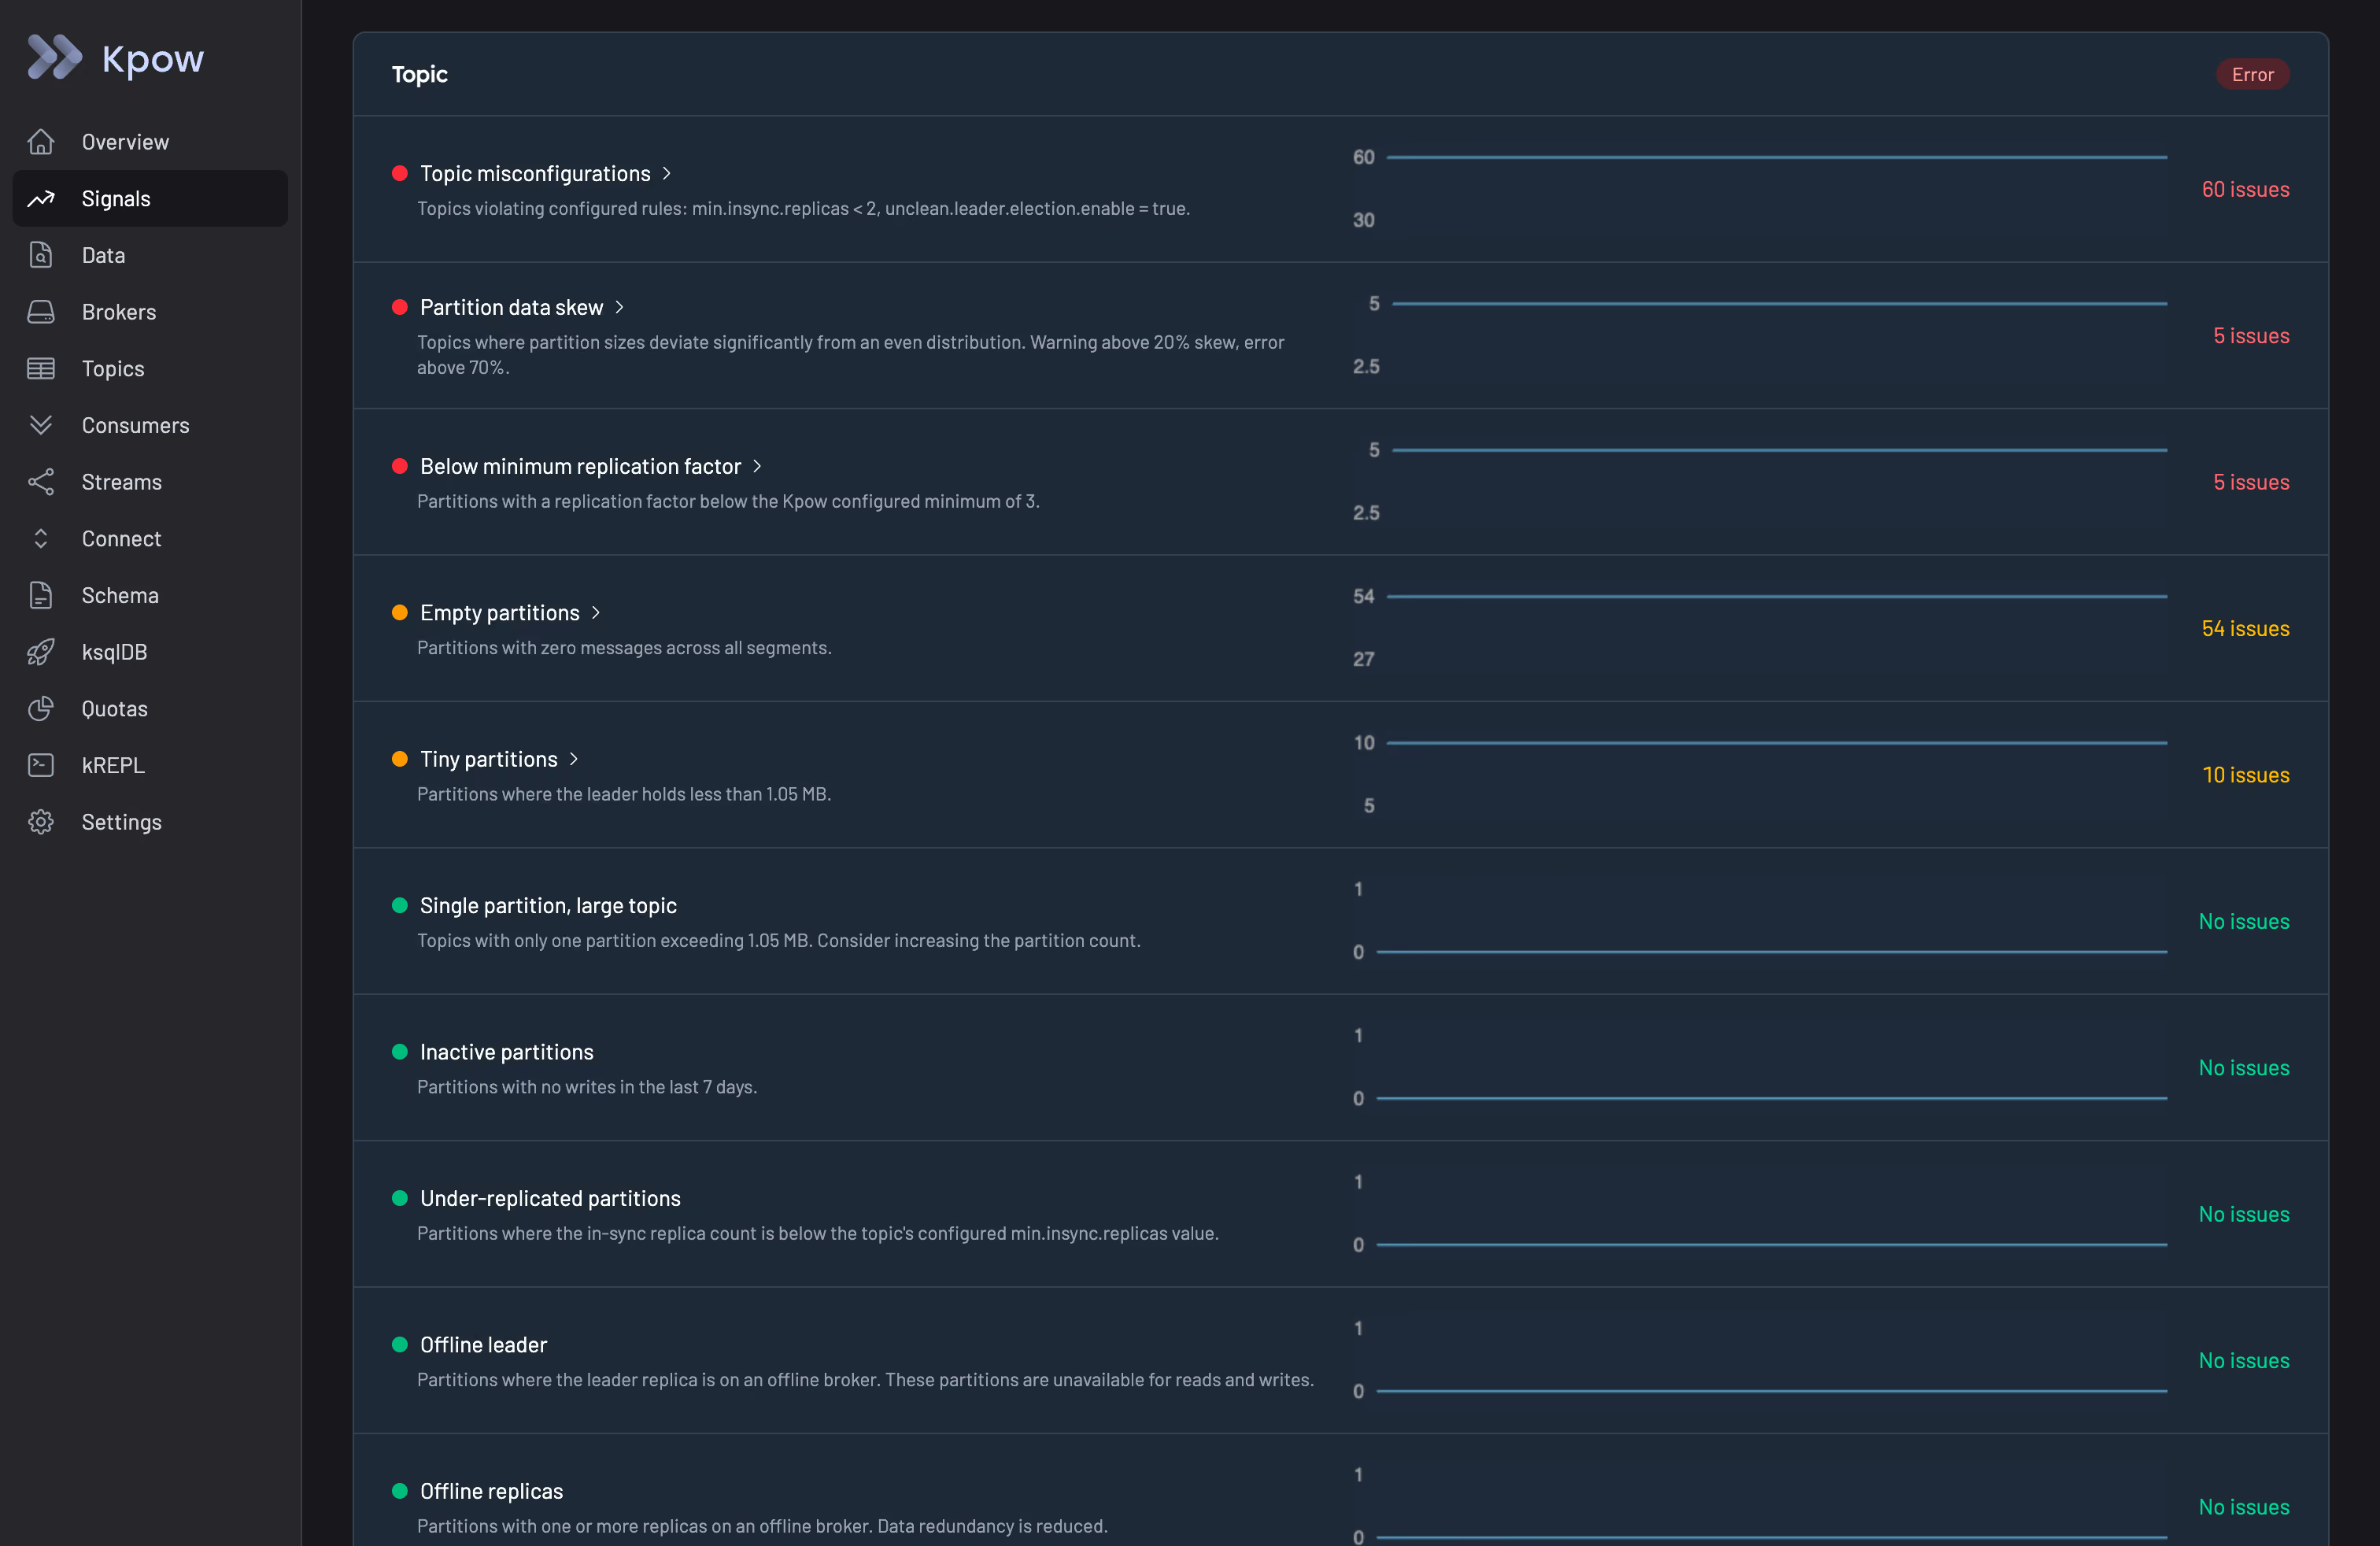
Broker & topic risk checks
Signals flags the specific conditions that turn into incidents before they do.
- Broker: unbalanced leader partitions, unbalanced data distribution
- Topic: offline leaders, offline replicas, under-replicated partitions, replication factor below your minimum, partition data skew
- Topic misconfiguration checks: min.insync.replicas below 2, unclean.leader.election.enable set to true
Consumer group risk & efficiency
Signals extends the same checks to consumer groups.
- Unbalanced member assignments: partition load spread unevenly across group members
- Idle members: a member-to-partition ratio past 2x flags a warning, past 5x an error, for members that consume resources without processing anything
Lag broken down by group, topic, partition, host, and broker, all in one view, with Kafka Streams applications detected automatically.
Yes. Live mode shows broker, topic, and consumer group metrics in real time as you connect, not a point-in-time snapshot you have to refresh.
Signals is Kpow's automated health-check layer: a cluster-wide health score plus specific checks across brokers, topics, and consumer groups (unbalanced partitions, under-replication, misconfiguration, idle consumers, and more).
Yes for trends: health score and issue counts are recorded as metrics over time. The issue list itself reflects the cluster's current state rather than a historical view.
Signals ships with sensible defaults for each check rather than requiring you to tune thresholds yourself. Configurable thresholds are being explored for Factor Platform.
The overview dashboard, live metrics, and consumer lag breakdown are available on both Community and Enterprise Edition. Signals is an Enterprise feature.
See lag, health, and risk across your cluster, in one place.
Live broker and topic metrics, lag broken down by group and partition, and automated health checks that flag risk before it becomes an incident.
Solo developer or smaller team? Use Kpow Community Edition for free